Create a subplot figure
Written by Chan Kimsan, 2022
Objective
Create a subplot figure consiting of 3 columns and 2 rows.
Code
[1]:
# import module
import geopandas as gpd
import matplotlib.pyplot as plt
[2]:
# input filepath
fp = 'data/Srepok_Basin.shp'

# read data
dataframe = gpd.read_file(fp)

# check the head row in dataframe
dataframe.head()
[2]:
| OBJECTID | GRIDCODE | Subbasin | Area | Slo1 | Len1 | Sll | Csl | Wid1 | Dep1 | ... | Shape_Area | HydroID | OutletID | 3Junec | 3AugC | 3NovC | 6Junec | 6AugC | 6NovC | geometry | |
|---|---|---|---|---|---|---|---|---|---|---|---|---|---|---|---|---|---|---|---|---|---|
| 0 | 55 | 55 | 55 | 28870.83 | 4.578035 | 4874.665581 | 91.435538 | 0.205142 | 38.624714 | 1.253508 | ... | 288708300.0 | 300055 | 100056 | -1.108180 | -1.10818 | -0.892015 | -1.108180 | -1.39446 | -1.39446 | POLYGON ((703549.617 1492389.931, 703549.617 1... |
| 1 | 56 | 56 | 56 | 24414.21 | 5.557022 | 6916.980515 | 60.957025 | 0.289144 | 34.928128 | 1.172197 | ... | 244142100.0 | 300056 | 100058 | -0.404028 | -1.10818 | 0.000000 | -0.404028 | -1.10818 | -1.10818 | POLYGON ((717319.617 1490679.931, 717319.617 1... |
| 2 | 57 | 57 | 57 | 24486.30 | 3.511215 | 22726.967517 | 91.435538 | 0.013200 | 34.989973 | 1.173580 | ... | 244863000.0 | 300057 | 100057 | -1.108180 | -1.89135 | -0.892015 | -1.108180 | -1.89135 | -1.39446 | MULTIPOLYGON (((718039.617 1496439.931, 718129... |
| 3 | 58 | 58 | 58 | 38749.59 | 6.978042 | 14922.230509 | 60.957025 | 0.187640 | 46.083980 | 1.410101 | ... | 387495900.0 | 300058 | 100062 | -0.551064 | -1.39446 | -0.551064 | -0.551064 | -1.39446 | -1.89135 | POLYGON ((808759.617 1486629.931, 808759.617 1... |
| 4 | 59 | 59 | 59 | 42588.18 | 6.231790 | 25090.678554 | 60.957025 | 0.175364 | 48.771168 | 1.464398 | ... | 425881800.0 | 300059 | 100063 | -0.551064 | -1.39446 | -0.551064 | -0.551064 | -1.39446 | -1.89135 | POLYGON ((812719.617 1481499.931, 812629.617 1... |
5 rows × 27 columns
[3]:
from mpl_toolkits.axes_grid1 import make_axes_locatable
# fig, ([ax1, ax4],[ax2,ax5],[ax3,ax6]) = plt.subplots(ncols=2, nrows=3, figsize=(15, 10), sharey=True)
fig, ([ax1, ax2, ax3],[ax4,ax5,ax6]) = plt.subplots(ncols=3, nrows=2, figsize=(15, 10), sharey=True)
divider1 = make_axes_locatable(ax1)
divider2 = make_axes_locatable(ax2)
divider3 = make_axes_locatable(ax3)
divider4 = make_axes_locatable(ax4)
divider5 = make_axes_locatable(ax5)
divider6 = make_axes_locatable(ax6)
cax1 = divider1.append_axes("right", size="5%", pad=0.1)
cax2 = divider2.append_axes("right", size="5%", pad=0.1)
cax3 = divider3.append_axes("right", size="5%", pad=0.1)
cax4 = divider4.append_axes("right", size="5%", pad=0.1)
cax5 = divider5.append_axes("right", size="5%", pad=0.1)
cax6 = divider6.append_axes("right", size="5%", pad=0.1)
dataframe.plot(ax=ax1, column="3Junec", cmap='hot', vmin=-2, vmax=0, legend=True, cax=cax1,
legend_kwds={'label': "Drought Index"});
dataframe.plot(ax=ax2, column="3AugC", cmap='hot', vmin=-2, vmax=0, legend=True, cax=cax2,
legend_kwds={'label': "Drought Index"});
dataframe.plot(ax=ax3, column="3NovC", cmap='hot', vmin=-2, vmax=0, legend=True, cax=cax3,
legend_kwds={'label': "Drought Index"});
dataframe.plot(ax=ax4, column="6Junec", cmap='hot', vmin=-2, vmax=0, legend=True, cax=cax4,
legend_kwds={'label': "Drought Index"});
dataframe.plot(ax=ax5, column="6AugC", cmap='hot', vmin=-2, vmax=0, legend=True, cax=cax5,
legend_kwds={'label': "Drought Index"});
dataframe.plot(ax=ax6, column="6NovC", cmap='hot', vmin=-2, vmax=0, legend=True, cax=cax6,
legend_kwds={'label': "Drought Index"});
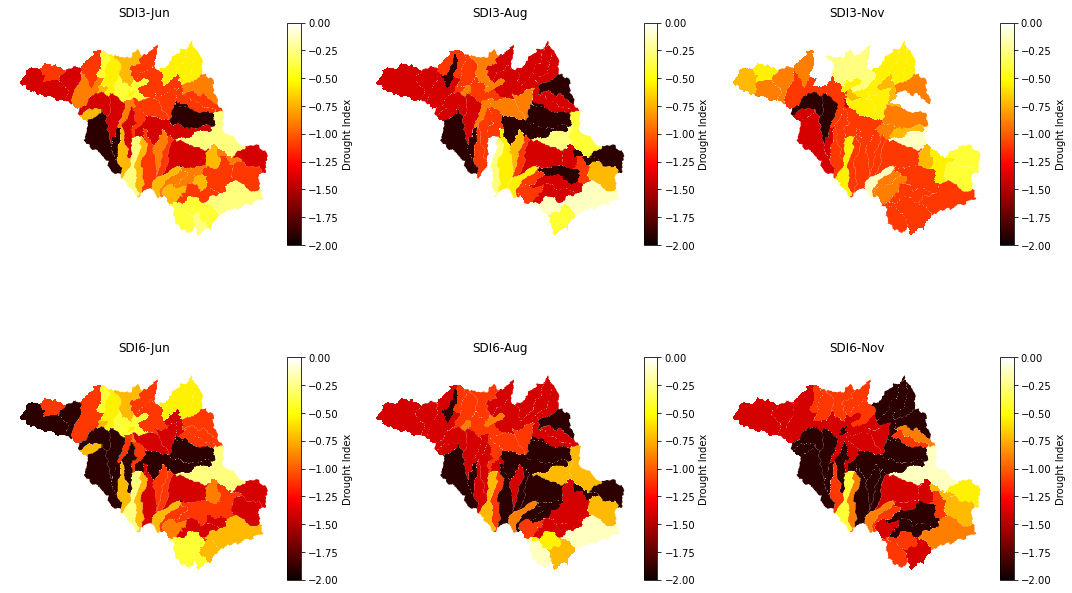
# Add titles
ax1.set_title("SDI3-Jun")
ax2.set_title("SDI3-Aug")
ax3.set_title("SDI3-Nov")
ax4.set_title("SDI6-Jun")
ax5.set_title("SDI6-Aug")
ax6.set_title("SDI6-Nov")
# Remove axis
ax1.axis('off')
ax2.axis('off')
ax3.axis('off')
ax4.axis('off')
ax5.axis('off')
ax6.axis('off')
plt.tight_layout()
plt.show();