Calculate monthly mean precipitation from CHIRPS Daily dataset
Written by Men Vuthy, 2022
Objective
Vizualize precipitation image of a given date in Cambodia.
Calculate monthly mean precipitation of Cambodia.
Dataset
Climate Hazards Group InfraRed Precipitation with Station data (CHIRPS) is a 30+ year quasi-global rainfall dataset. CHIRPS incorporates 0.05° resolution satellite imagery with in-situ station data to create gridded rainfall time series for trend analysis and seasonal drought monitoring.

Code
1. Visualize dataset
CHIRPS Daily dataset can be visualized using the code snippet below:
// Import CHIRPS dataset and filter to 01-Sep-2020
var dataset = ee.ImageCollection('UCSB-CHG/CHIRPS/DAILY')
                .filter(ee.Filter.date('2020-09-01', '2020-09-02'));

// Select bands
var precipitation = dataset.select('precipitation');

// Create visualization palette
var precipitationVis = {
    min: 1.0,
    max: 17.0,
    palette: ['001137', '0aab1e', 'e7eb05', 'ff4a2d', 'e90000'],
};

// Set center for zooming
Map.setCenter(104.405, 13.158, 6);

// Add layer to map
Map.addLayer(precipitation, precipitationVis, 'Precipitation');

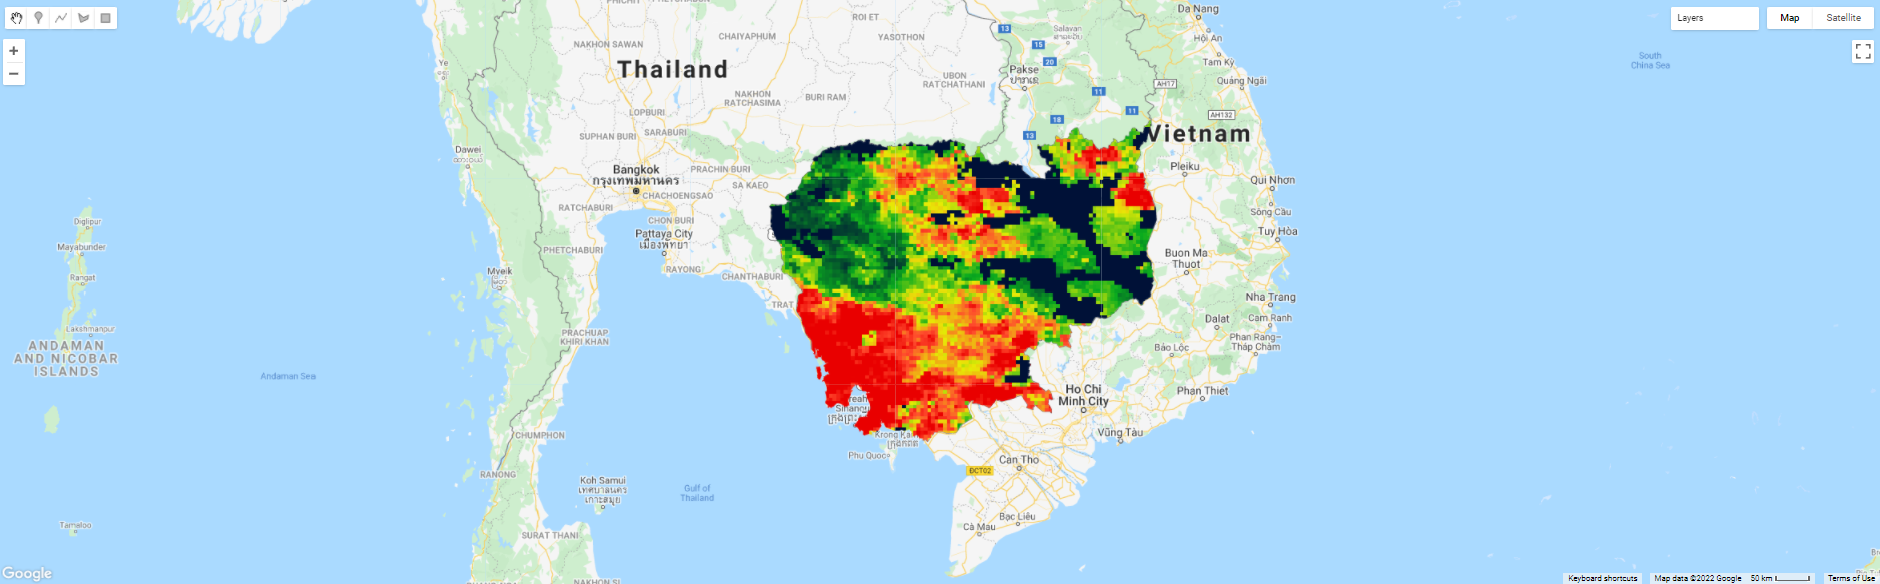
2. Visualize precipitation in Cambodia
The feature boundary of Cambodia is based on the international boundary dataset provided by The United States Office of the Geographer. The boundary data is available in GEE and known as LSIB 2017: Large Scale International Boundary Polygons. The country name code can be referred to FIPS country codes. With this feature, we can clip the global rainfall image to the shape of our region of interest.
// Load country features from Large Scale International Boundary (LSIB) dataset.
var countries = ee.FeatureCollection('USDOS/LSIB_SIMPLE/2017');

// Filter boundary to Cambodia with the code name 'CB'
var roi = countries.filter(ee.Filter.eq('country_co', 'CB'));

// Filter images to 01 Sep 2020 and clip it
var rainfall = dataset.filter(ee.Filter.calendarRange(2020, 2020, 'year'))
                    .filter(ee.Filter.calendarRange(9, 9, 'month'))
                    .sum()
                    .clip(roi);

// Add layer to map
Map.addLayer(rainfall, precipitationVis, 'Rainfall');

// Add layer to map
Map.addLayer(temp, temperatureVis_cambo, 'Temperature');
3. Extract all precipitation images within given year
To calculate mean precipitation of each month, we must set a target year and then extract all the images from image collection that correspond to the given year.
// set start year and end year
var startyear = 2019;
var endyear = 2021;

// make a list with years
var years = ee.List.sequence(startyear, endyear);

// make a list with months
var months = ee.List.sequence(1, 12);

// Extract all rainfall images within given year
var monthlyPrecip =  ee.ImageCollection.fromImages(
 years.map(function (y) {
    return months.map(function(m) {
    var w = dataset.filter(ee.Filter.calendarRange(y, y, 'year'))
                    .filter(ee.Filter.calendarRange(m, m, 'month'))
                    .sum();
    return w.set('year', y)
            .set('month', m)
            .set('system:time_start', ee.Date.fromYMD(y, m, 1));
    });
}).flatten()
);

print(monthlyPrecip)
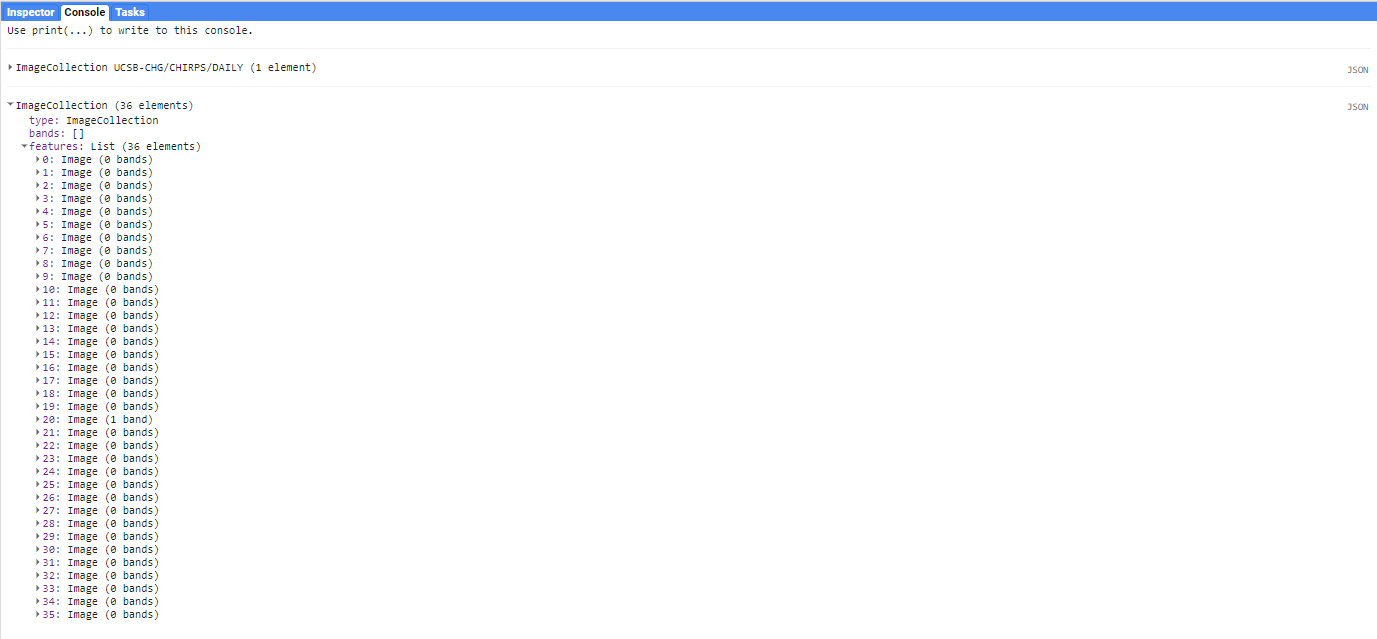
4. Calculate monthly mean precipitation of Cambodia
After extracting images of given year, we can see that there are in total of 36 images which respond to 36 months or 3 years. In each image, there are a wide range of precipitation value in mm. Therefore, we need to calculate the mean precipitation of each image to get 36 mean precipitation value. To do so, we can use a function call ee.Reducer.mean() as follows:
// Import CHIRPS dataset and filter to 01-Sep-2020
var dataset = ee.ImageCollection('UCSB-CHG/CHIRPS/DAILY');

// Select bands
var precipitation = dataset.select('precipitation');

// Calculate mean precipitation and create a bar chart.
var chartMonthly = ui.Chart.image.seriesByRegion({
    imageCollection: monthlyPrecip,
    regions: roi,
    reducer: ee.Reducer.mean(),
    band: 'precipitation',
    scale: 5566,
    xProperty: 'system:time_start',
    seriesProperty: 'precipitation',
})
.setChartType('ColumnChart')
.setOptions({ title: 'Monthly temperature - Cambodia - 2019~2020',
              hAxis: {title: 'Month', titleTextStyle: {italic: true, bold: false}},
              vAxis: {title: 'Precipitation (mm)', titleTextStyle: {italic: true, bold: false}},
              colors: ['0f8755']
            });

print(chartMonthly);
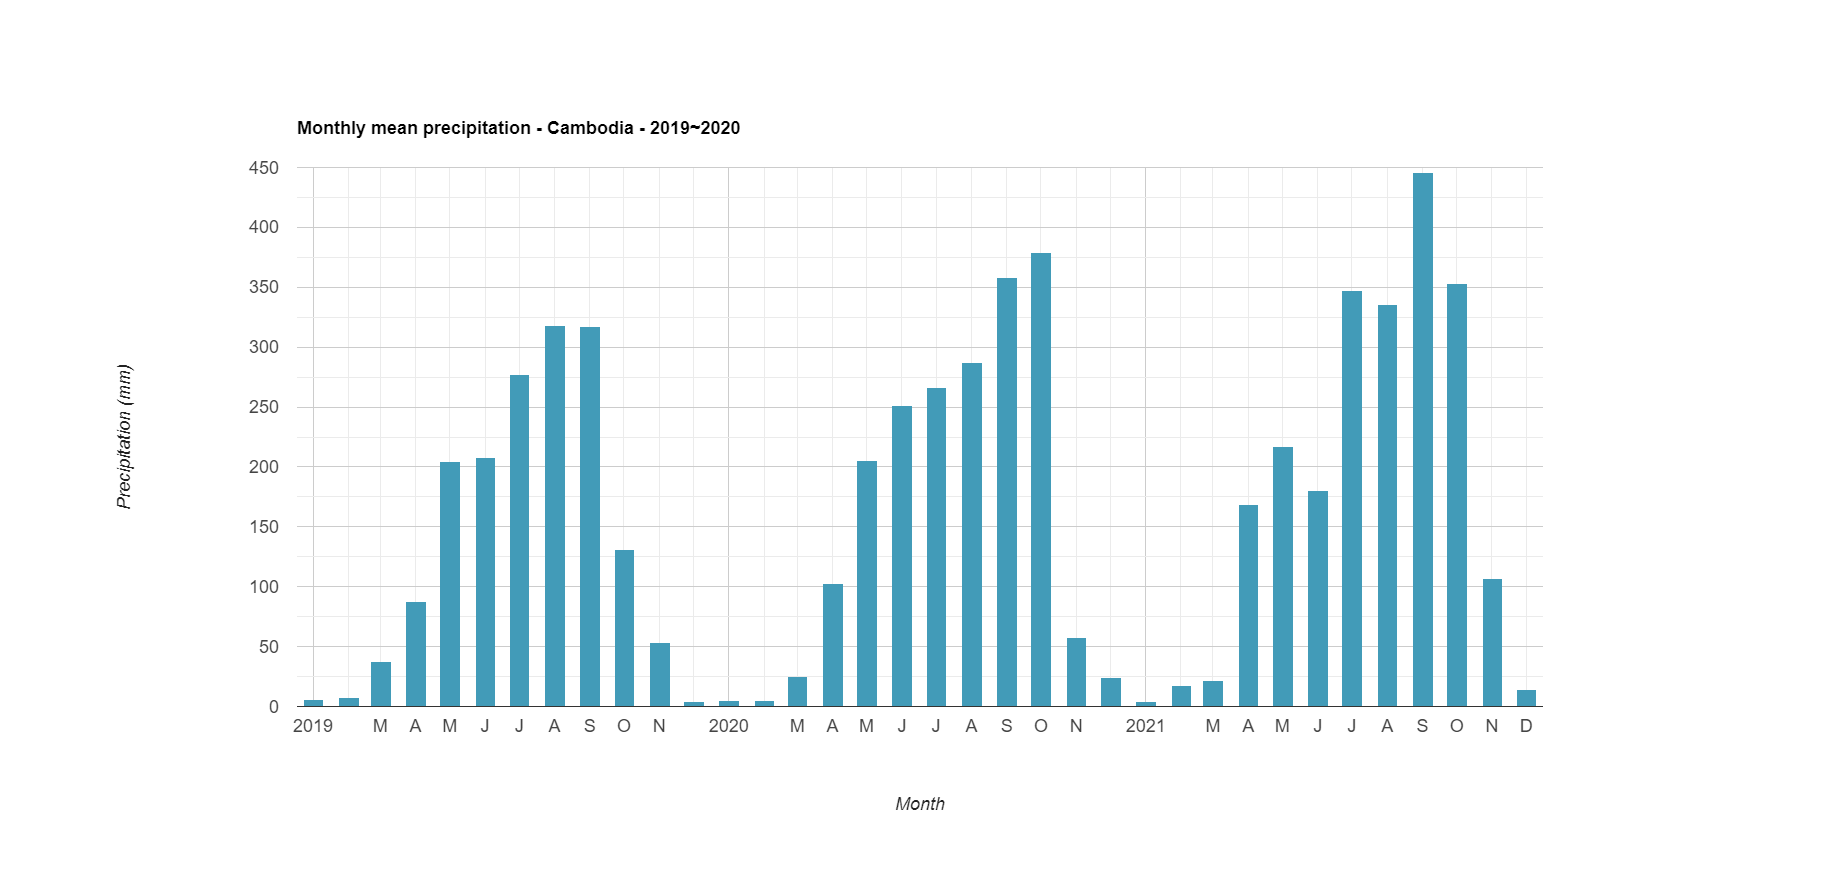
Finally, we can see how to calculate and download monthly mean precipitation from CHIRPS Daily dataset in Google Earth Engine.
Reference
CHIRPS Daily: https://developers.google.com/earth-engine/datasets/catalog/UCSB-CHG_CHIRPS_DAILY
LSIB 2017: https://developers.google.com/earth-engine/datasets/catalog/USDOS_LSIB_SIMPLE_2017#description
ui.Chart.image.seriesByRegion: https://developers.google.com/earth-engine/apidocs/ui-chart-image-seriesbyregion
ee.Reducer.mean : https://developers.google.com/earth-engine/apidocs/ee-reducer-mean