5. Validation Data
Written by Men Vuthy, 2021
Import packages
[1]:
import os
import rasterio
import numpy as np
import pandas as pd
import matplotlib.pyplot as plt
import geopandas as gpd
5.1 Paddy Points
Create raster image based on no-noise data
[2]:
# Read data
DF_NDVI = pd.read_csv('output/3/no_noise_data/no_noise_ndvi.csv')
[3]:
DF_NDVI = DF_NDVI.iloc[4:, :].reset_index(drop=True)
[4]:
NDVI = DF_NDVI.T
NDVI.insert(0, 'id', NDVI.index[:])
[5]:
# Add one image for projection and shape reference
raster = rasterio.open("input/ndvi_2011/2010_01_01.tif")
[6]:
# Re-arrange cluster range
indx = []
for i in range(0,392313):
    indx.append(i)

Index = pd.DataFrame()
Index['id'] = indx

df1 = Index.set_index('id')
df2 = NDVI.set_index('id')
df2 = NDVI.set_index(df2.index.astype('int64')).drop(columns=['id'])
mask = df2.index.isin(df1.index)

for i, j in zip(range(len(df2.columns)), df2.columns):
    df1[j] = df2.loc[mask, j]

Smooth_NDVI = df1
[7]:
# Reshape the cluster array
Array_list = []

for i in range(len(Smooth_NDVI.columns)):
    array = np.array(Smooth_NDVI[i])
    NDVI_array = array.reshape(raster.read().shape)
    Array_list.append(NDVI_array)
[8]:
# Create array of smooth ndvi
NDVI_array = np.array(Array_list)
NDVI_array = np.moveaxis(NDVI_array, [0, 1, 2, 3], [1, 0, 2, 3])
NDVI_array = NDVI_array[0]
NDVI_array.shape
[8]:
(65, 521, 753)
Export image as tiff
[9]:
# Data dir
data_dir = "output/4/no_noise_img"

# Output raster
out_tif = os.path.join(data_dir, "no_noise_ndvi.tif")

# Copy the metadata
out_meta = raster.meta.copy()
out_meta

# Update the metadata
out_meta.update({'driver': 'GTiff',
                 'dtype': 'float32',
                 'nodata': None,
                 'width': raster.shape[1],
                 'height': raster.shape[0],
                 'crs': raster.crs,
                 'count':65,
                 'transform': raster.transform
                })
[10]:
with rasterio.open(out_tif, "w", **out_meta) as dest:
    dest.write(NDVI_array.astype(np.float32))
NDVI timeseries at allpaddy points
[11]:
# Read data
NDVI_img = rasterio.open('output/4/no_noise_img/no_noise_ndvi.tif')
NN_NDVI = NDVI_img.read()
[12]:
plt.imshow(NN_NDVI[0]);

Paddy Points
[13]:
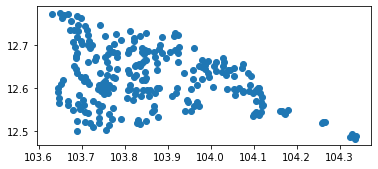
paddy = gpd.read_file('input/paddy_point/paddy_points.shp')
[14]:
paddy.plot();
Extract ndvi based on paddy points
[15]:
NDVI_List = []

for point in paddy['geometry']:

    for i in range(1, NN_NDVI.shape[0]+1):

        # Select row and column
        x = point.xy[0][0]
        y = point.xy[1][0]

        # Locate x and y of point to get row and col of raster
        row, col = NDVI_img.index(x, y)

        # Extract band value
        ndvi = NDVI_img.read(i)[row,col]

        # Append to list
        NDVI_List.append(ndvi)
[16]:
# Create array of ndvi
ndvi_array = np.array(NDVI_List)

# Reshape array of ndvi
ndvi_reshape = ndvi_array.reshape((len(paddy['geometry']),NN_NDVI.shape[0]))

# Create ndvi dataframe
DF_Validation = pd.DataFrame(ndvi_reshape).T
DF_Validation
[16]:
| 0 | 1 | 2 | 3 | 4 | 5 | 6 | 7 | 8 | 9 | ... | 240 | 241 | 242 | 243 | 244 | 245 | 246 | 247 | 248 | 249 | |
|---|---|---|---|---|---|---|---|---|---|---|---|---|---|---|---|---|---|---|---|---|---|
| 0 | 0.30656 | 0.30070 | 0.30872 | 0.300300 | 0.37614 | 0.31070 | 0.30242 | 0.29408 | 0.29544 | 0.26586 | ... | 0.30484 | 0.29380 | 0.27422 | 0.27342 | 0.31036 | 0.304780 | 0.31180 | 0.27698 | 0.30098 | 0.29138 |
| 1 | 0.29246 | 0.28526 | 0.29392 | 0.284140 | 0.32442 | 0.30164 | 0.28660 | 0.27876 | 0.27948 | 0.25624 | ... | 0.29132 | 0.28620 | 0.27160 | 0.26406 | 0.29812 | 0.294360 | 0.29170 | 0.26322 | 0.28980 | 0.27682 |
| 2 | 0.27646 | 0.26858 | 0.27812 | 0.266300 | 0.28486 | 0.29054 | 0.27436 | 0.25870 | 0.26574 | 0.24814 | ... | 0.27436 | 0.27408 | 0.25940 | 0.25310 | 0.28879 | 0.277280 | 0.27496 | 0.25308 | 0.28497 | 0.26114 |
| 3 | 0.25586 | 0.25887 | 0.26424 | 0.254440 | 0.26746 | 0.28112 | 0.26374 | 0.24062 | 0.25246 | 0.24176 | ... | 0.26446 | 0.26924 | 0.25938 | 0.25504 | 0.28456 | 0.281160 | 0.27192 | 0.24560 | 0.28063 | 0.25934 |
| 4 | 0.24462 | 0.24799 | 0.25640 | 0.248320 | 0.25348 | 0.28048 | 0.26200 | 0.23238 | 0.24636 | 0.24074 | ... | 0.25602 | 0.26310 | 0.25464 | 0.24824 | 0.28728 | 0.292160 | 0.27214 | 0.24758 | 0.28195 | 0.25890 |
| ... | ... | ... | ... | ... | ... | ... | ... | ... | ... | ... | ... | ... | ... | ... | ... | ... | ... | ... | ... | ... | ... |
| 60 | 0.41578 | 0.56593 | 0.68400 | 0.680193 | 0.60364 | 0.64858 | 0.67000 | 0.49599 | 0.63586 | 0.54138 | ... | 0.41742 | 0.43984 | 0.28020 | 0.66948 | 0.37100 | 0.314643 | 0.38560 | 0.30576 | 0.38422 | 0.46544 |
| 61 | 0.48096 | 0.57599 | 0.58410 | 0.556433 | 0.47780 | 0.53500 | 0.54704 | 0.49667 | 0.57608 | 0.58816 | ... | 0.50790 | 0.50404 | 0.36424 | 0.63130 | 0.42864 | 0.380443 | 0.42784 | 0.36670 | 0.45080 | 0.47698 |
| 62 | 0.53590 | 0.58783 | 0.52778 | 0.427653 | 0.38446 | 0.45966 | 0.44826 | 0.50061 | 0.52678 | 0.60048 | ... | 0.56946 | 0.51574 | 0.37734 | 0.58740 | 0.46686 | 0.452003 | 0.42184 | 0.43670 | 0.51632 | 0.48336 |
| 63 | 0.56918 | 0.55715 | 0.44346 | 0.378940 | 0.36458 | 0.44692 | 0.39998 | 0.50132 | 0.45886 | 0.63756 | ... | 0.58910 | 0.54578 | 0.42698 | 0.54918 | 0.58010 | 0.549100 | 0.46714 | 0.56082 | 0.57142 | 0.53050 |
| 64 | 0.57440 | 0.53922 | 0.36418 | 0.380320 | 0.46214 | 0.44940 | 0.39912 | 0.48398 | 0.43058 | 0.57456 | ... | 0.59070 | 0.51490 | 0.45468 | 0.48188 | 0.61056 | 0.603920 | 0.51218 | 0.60378 | 0.56238 | 0.52114 |
65 rows × 250 columns
Save result
[17]:
DF_Validation.to_csv('output/4/validation_data/validation_paddy.csv', index = False)
Visualize data
[18]:
DF_Validation = pd.read_csv('output/4/validation_data/validation_paddy.csv')
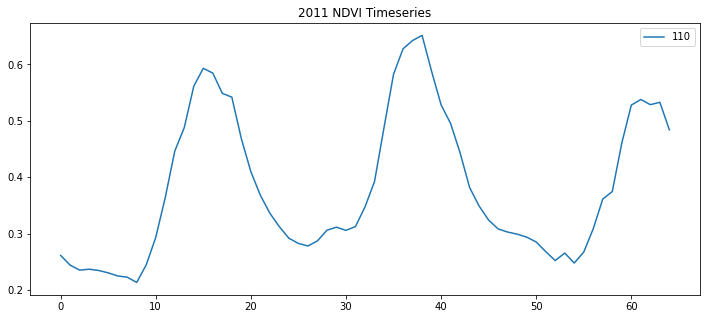
[19]:
i = 110 # column number or pixel numer
j = i+1

# Plot between noised and smoothed ndvi
fig, ax = plt.subplots(figsize=(12,5))
ax = DF_Validation.iloc[:,i:j].plot(ax=ax)
ax.set_title('2011 NDVI Timeseries')
[19]:
Text(0.5, 1.0, '2011 NDVI Timeseries')
5.2 Paddy Classes
Visualize data
[20]:
# Arrange dataframe for plot
DF_Validation = pd.read_csv('output/4/validation_data/validation_paddy.csv').T

Date = pd.read_csv('output/2/date_img/date_img.csv').iloc[:65]

date = []
for i in Date.iloc[:].values:
    date.append(i[0])

DF_Validation.columns = date

DF_Validation = DF_Validation.T
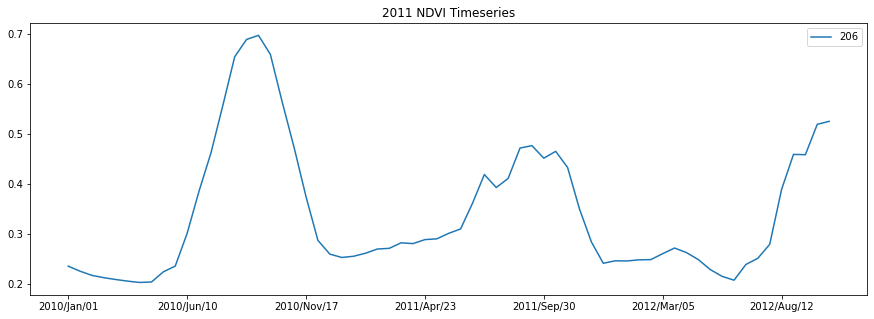
[21]:
i = 206 # column number or pixel numer
j = i+1

# Plot between noised and smoothed ndvi
fig, ax = plt.subplots(figsize=(15,5))
ax = DF_Validation.iloc[:,i:j].plot(ax=ax)
ax.set_title('2011 NDVI Timeseries')
[21]:
Text(0.5, 1.0, '2011 NDVI Timeseries')
[22]:
Date = pd.read_csv('output/2/date_img/date_img.csv').iloc[:65]